

Bring back Google Flu Trends
The poster child of digital public health surveillance is better than its reputation - and is sorely missed in the aftermath of COVID-19.

In early 2009, digital public health surveillance got its first poster child with the public launch of Google Flu Trends. The idea behind it was strikingly simple. When people come down with influenza-like illnesses (ILI), they will often search online for information related to their infection. As the dominant search platform by far, Google has access to those search queries in real time. Using this data source as input for a model that outputs estimated ILI incidence could create a substantial time advantage compared to the reported ILI incidence estimates by public health authorities.
Official ILI estimates have a major disadvantage: they always lag behind 1-2 weeks. How exactly these estimates are generated varies from country to country, but most modern public health systems use a sentinel network, where participating health care professionals regularly share their local ILI activity with the public health authority, who then summarizes these data, sometimes along with other data sources, in a weekly ILI estimate. This process requires time, from patients scheduling visits to health care professionals, to collecting, summarizing, and publishing the data.
The Google Flu Trends paper “Detecting influenza epidemics using search engine query data” developed a method of fitting a model to ILI-related search queries with the goal of improving early disease detection by leveraging the millions of ILI-related searches that Google receives around the world each day.
A few years later, Google closed the public access to the system, after it had completely missed the 2009 influenza A(H1N1) pandemic, and substantially overestimated ILI incidence in the 2012-2013 flu season in the US. What started as a poster child for digital public health surveillance had transformed into a poster child for big data hubris. Multiple papers appeared, highlighting the flaws of Google Flu Trends. Eventually, the criticism died down, and the world of public health moved on - and missed a chance. Today, we know that digital public health surveillance can produce accurate estimates of disease incidence, in real time, and that estimates produced by sentinel systems - the gold standard in flu estimates - have substantial problems. We’ve thrown out the baby with the bathwater. It’s time we bring it back.
A brief history of digital public health surveillance with search queries
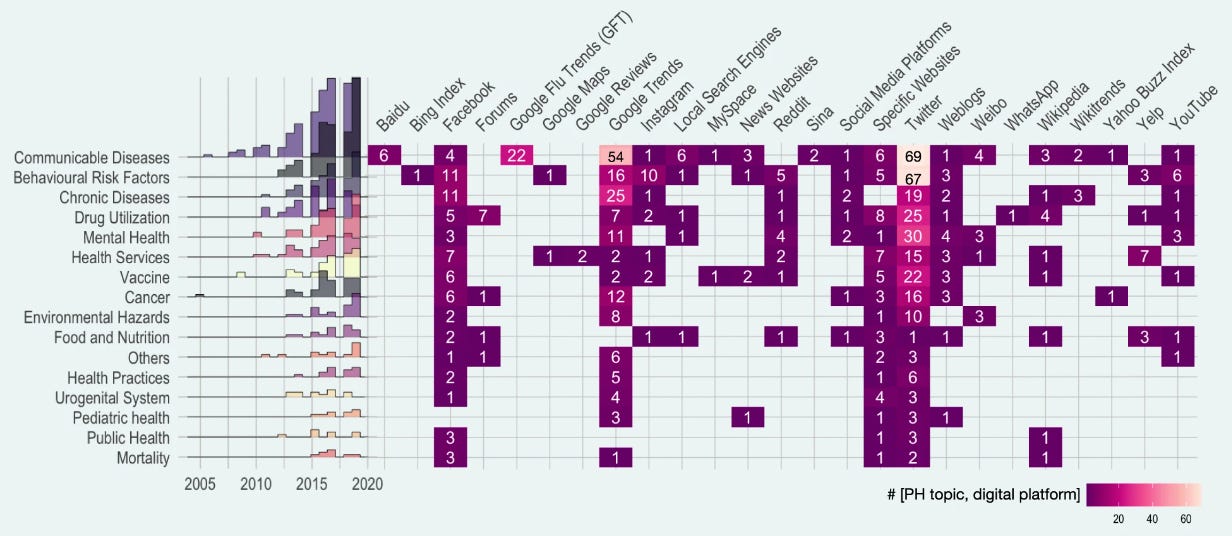
The Google Flu Trends paper marked a turning point for the field, as it was the first time that digital data, generated for a purpose (online search) other than epidemiology or public health, had been used at scale for digital public health surveillance. In the following years, multiple new approaches were proposed, with data sources going beyond search queries, including social media, online forums, news outlets, website access logs, and data from mobile devices, to mention just a few. In 2019, the dominant sources for digital public health surveillance studies were Twitter, Google Trends, and Facebook. (Here’s to hoping that the Twitter API will remain open for research 🙏)
It’s important to note that the researchers at Google were not the first to think about the usefulness of search query data for ILI surveillance. A 2006 paper by Gunther Eysenbach developed the same idea, but because independent researchers didn’t have access to Google’s search volume data at the time, he had to resort to a simple yet powerful idea: estimating the volume of search queries by geographic region for ILI-relevant terms by leveraging the Google advertising system normally used for commercial advertisers. His results, limited to Canada, demonstrated that clicks on an ad that was shown when people were searching for “flu” or “flu symptoms'' correlated highly with next-week flu incidence (measured by the number of lab tests and cases in the following week). Interestingly, the correlation between next week incidence and click counts on the Google ad was higher than the correlation between next-week flu incidence and ILI reported by sentinel physicians. Similarly, a 2008 study by Philip Polgreen et al. showed that US search query data from Yahoo! (a once popular search engine) for certain flu-related terms correlated strongly with influenza disease activity.
Google Flu Trends built on this and other work by extending it in three significant ways. First, it operated at a scale previously unheard of, processing hundreds of billions of searches. Second, rather than just running a one-off research study, GFT developed an automated system that it made publicly available for many years. Third, rather than choosing search terms based on domain expertise, GFT developed a method of selecting ILI-related search queries from a list of 50 million candidate queries. A linear model fitted to weekly ILI percentages between 2003 and 2007 for all US surveillance regions resulted in a mean correlation of 0.90 (see below). It further showed that its estimates were consistently 1-2 weeks ahead of published reports by the CDC sentinel network.

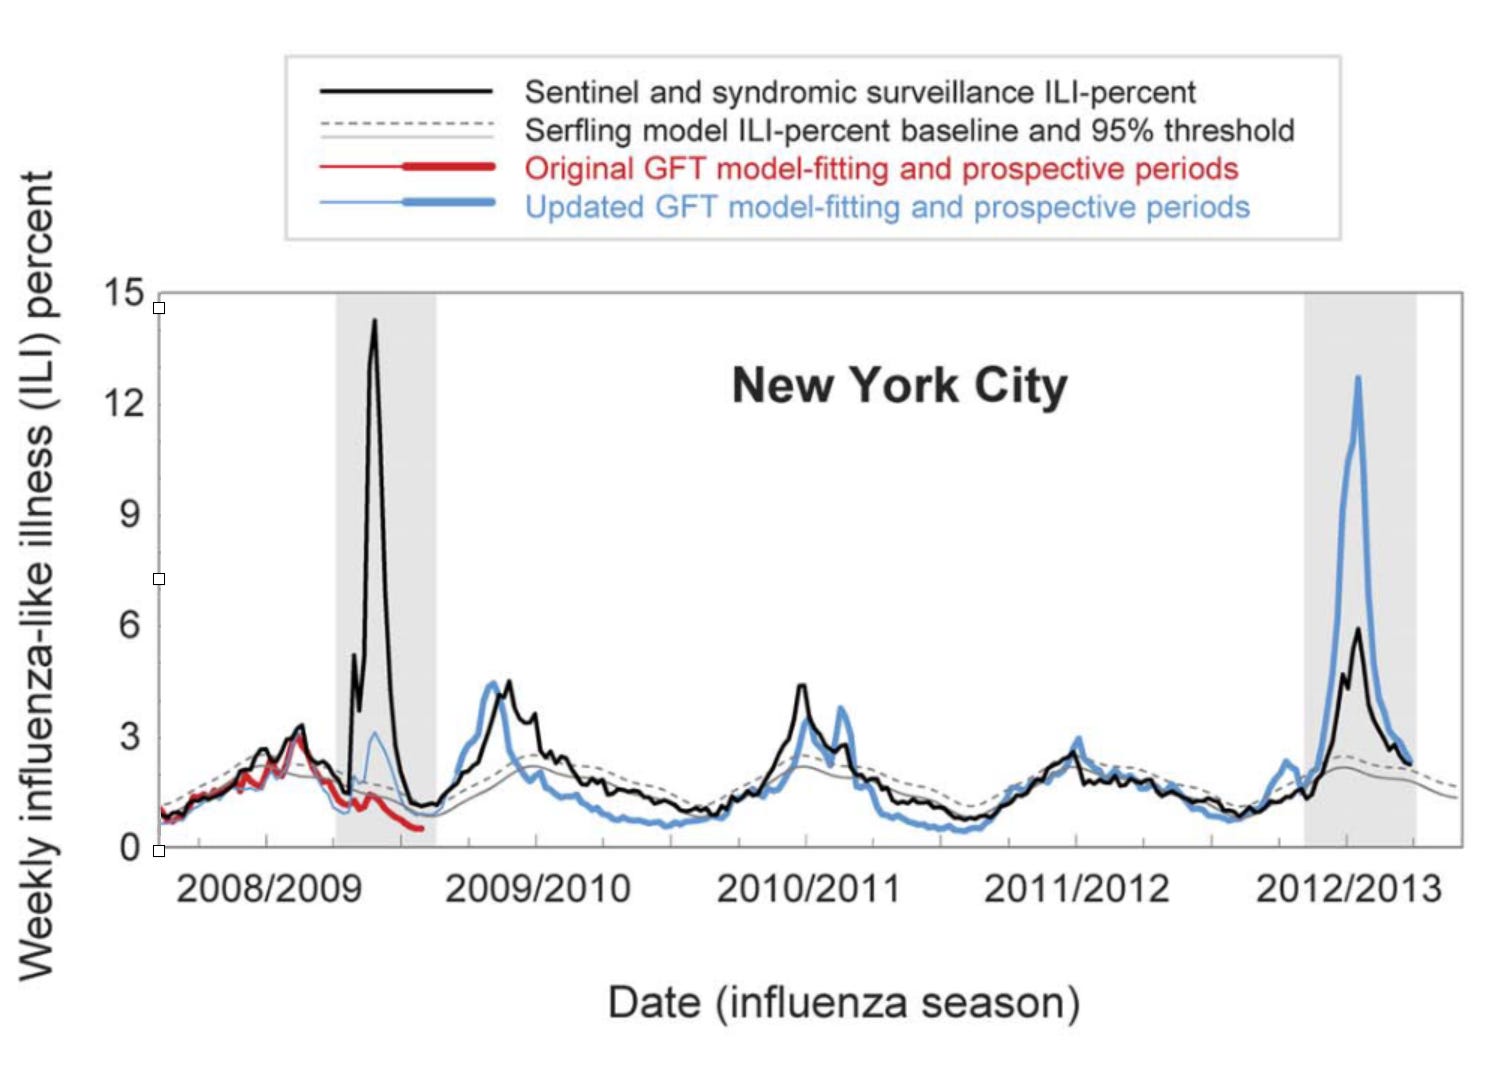
GFT was a welcomed addition to the portfolio of public health surveillance indicators. However, it was not without its problems, as stated in the paper clearly (“Despite strong historical correlations, our system remains susceptible to false alerts caused by a sudden increase in ILI-related queries.”). Nobody could guess that just a few weeks after the publication of the paper, the system would undergo its first stress test with the emergence of pandemic influenza A H1N1 in the spring of 2009. Post-pandemic analyses have shown that the model did not produce good estimates (r = 0.29) in the summer of 2009, and some weeks in the spring have to be excluded from search query analyses due to the enormous media attention during those weeks. Any system can be forgiven to crack under such a severe stress test of a highly unusual event right after its launch, and indeed, an updated model produced again very good results (r = 0.95). However, in the 2012/2013 US flu season, GFT produced estimates that were at times double the size of the estimates by the health authorities, as shown below:
A number of factors likely contributed to these outcomes. First, the search terms that made it into the original GFT model may have shown a strong seasonal pattern, coinciding with flu seasonality. This would explain why the pandemic influenza A(H1N1) wave went undetected by GFT, as it occurred during a time of the year (mid- to late spring) by which seasonal flu has usually all but disappeared. Furthermore, even for search terms that are closely related to influenza, the query volume would be greatly influenced by public interest which may be driven by media coverage as well as by actual flu cases. This could explain the overshooting in 2012/2013, which was an unusually strong flu season during which media interest in the flu was high. It’s difficult to make conclusive statements about these hypotheses as the search terms included in GFT models remain unknown. It is also worth noting that the relative search volume may be affected by “blue team” and “read team” issues. The former refers to the fact that the relative search volumes themselves may be affected by the Google search algorithm and its results. The latter refers to malicious attempts to modify search volumes for someone else’s gain. As is the case with the other issues, it is virtually impossible to determine the factors influencing the performance of GFT.

But at second glance…
At first, these results look sobering, and one could be tempted to think that digital public health surveillance with search queries is simply not good enough. In 2015, Google closed the public access to GFT, limiting access to researchers. But we should consider that the GFT predictions were not all that far off most of the time, and that the system was in its early days. Subsequent work by Kandula and Shaman has shown that on the one hand, GFT can be improved, and that on the other hand, the official reports are not without problems either. Indeed, ILI reports by the CDC are only partial data (ILIp), and the full (ILIf) reports are only published 2-3 weeks later, after most decisions related to influenza incidence have been made. Thus, to make the comparison fair, errors in the predictions from any GFT-like model should be contrasted with errors from the ILIp estimates available at the time of the comparison, an important factor that retrospective analyses in particular need to take into account. Further, ILI predictions from a corrected GFT model - a random forest regression model with ILI and GFT rates from the previous three weeks as predictors - were at least as accurate as the ILI estimates from the CDC, and very often more accurate, even in atypically large outbreaks such as the 2017/2018 and 2018/2019 outbreaks in the US . The table below shows that while the errors of the original GFT model were higher than the errors from ILIp (sometimes strikingly so, as in 2012/2013), the corrected GFT performs better than ILIp in almost all cases.

Another way to improve the model is to combine it with more data sources, for example from social media. Work by Santillana et al. demonstrated that combining multiple influenza-like illnesses (ILI) activity estimates - such as GFT, tweets, official near-real-time hospital visit records, and data from a participatory surveillance systems - could produce more accurate influenza activity estimates. A key benefit of this ensemble approach is that when one of the predictors produces unreliable estimates, ensemble estimates may nevertheless remain robust.
What’s next?
Digital public health surveillance is in its teenage years. The first attempts more than a decade ago were promising, but researchers have pointed out major flaws of the initial systems, which helped to pave the way for improvements and new developments. Today, we understand that by continuously adjusting these systems, and by combining multiple data sources, they can be improved to a point where they are as good as, or even better than, the traditional surveillance systems. They should thus be used by public health, and continuously improved upon.
Why, then, are we not hearing from these digital systems anymore? The COVID-19 pandemic has noticeably changed our patterns of search for infectious diseases, as epidemiology and public health have become dominant themes in the media. Interest in topics normally only discussed in public health contexts (like “herd immunity”) has grown to unprecedented levels due to the extensive media coverage they have been receiving. Arguably, this has made the challenge of building robust digital public health surveillance systems quite a bit harder (just look at search volumes for “flu” in the spring of 2020, a period of normal flu activity for the time of the year).

However, technology has advanced dramatically since the early days of Google Flu Trends. It should become increasingly possible to understand why someone has searched for a particular disease, and our capacity to automate text comprehension from social media is getting increasingly close to perfect. And while the technology has advanced, the use of internet services globally has further increased, and along with it our ability to utilize the data for public health purposes. Indeed, people will continue to search online for symptoms, and to share experiences about disease on social media, independent of what public health does with the data.
I think another key problem lies in the well-known issues of academic publishing, open data, and science communication. A new system comes along, developed by a well-known tech player, arguing it can provide an alternative approach to an existing public health system. Because it’s exciting and relevant, it gets exposure in a top journal and lots of media attention. The authors are careful to point out the limitations of their system, and that it is not meant as a replacement of the existing system, but this caveat gets ignored. Other researchers start probing the system and detect major flaws. Once again, the criticism gets major academic and media attention. The tech player cannot seriously defend itself against the criticism, because it is not willing to make the underlying data openly available. And even as more people begin to work on the problem and to fix the underlying issues, minds have been made up, and the train has moved on (or rather has returned to the status quo).
This is a missed opportunity. We would all benefit from having highly accurate estimates of disease activity. Any complement to the traditional surveillance systems should be welcomed, provided it improves the existing estimates. We must also not fall prey to the narrative of “we should rather invest in making the existing public health systems better” - adding alternative data sources is making the existing system better. It is highly unlikely that a dollar invested in digital data sources is a dollar taken away from local public health, given that the digital data sources are almost always created for purposes different from traditional surveillance. The scientific process - iteratively improving the outcomes through publicly checking each others’ results - is working. It’s the final step of integrating these improved outcomes into public health action that’s missing here.