

A Digital Cohort on Personalized Nutrition
My lab has just published the first pre-print paper from the Food & You cohort, a digital study on personalized nutrition with 1,000+ participants, documenting the consumption of over 46 million kcal.

I’m excited to share our first preprint from the Food & You study. My team and I have been working on this since 2016. Why did it take seven years for the first papers to be published? There are two answers: new technology and the pandemic. I guess the second point doesn’t need a lot of explanation, so I’ll focus on the first.
In this post, I’d like to share some insights and background details about this cohort. As I discuss in my book on digital epidemiology, I believe that digital cohorts represent a significant advancement in the medical field. Since there aren't many digital cohorts yet, I hope this background information will be helpful to some readers who may be planning similar studies, or be involved in them.
What is Food & You?
“Food & You” is a personalized nutrition study conducted as a fully digital cohort. Participants tracked their food intake, physical activity, glycemia, and other data for two to four weeks. In addition, they shared a stool sample with us, which allowed us to obtain information about their gut microbiota. The study aimed to understand how these factors interact so that we can develop personalized nutrition algorithms for glucose level management. It is a digital cohort in the sense that all data collection happened digitally or was coordinated digitally.

The paper we’ve just released as a preprint has its roots in 2016. At that time, I had already decided to focus my research on nutrition and its impact on health outcomes. My previous work as a digital epidemiologist was predominantly focused on infectious diseases, but I’ve come to appreciate the substantial impact that nutrition has on health. It seemed clear that digital approaches could be very useful in studying nutrition.
Instead of merely scraping data from third-party sources, I felt that developing our own cohort would be more exciting and sustainable. However, establishing and managing a new cohort from scratch, especially at this scale, is not something that a single lab typically does. It was evident that we needed to go fully digital to make this possible.
Digital cohorts
This is where the concept of a digital cohort comes in. A digital cohort is a study where data collection is entirely digital, or digitally coordinated in the case of non-digital data (such as stool samples). The digital approach has a key advantage: you don’t need a physical infrastructure to meet with participants. This makes the digital cohort approach highly scalable.
However, there are some serious potential downsides to digital: retention, already a challenge in conventional studies, can become a severe problem. Yes, it is easy to onboard people digitally. But it is just as easy for them to disengage if, at any point, they feel that participating is not worth their time.
Having participated in some online studies myself, I know just how poor some of the digital experiences can be. Many study websites have a look and feel that is outdated. Mobile-friendly is often an afterthought. Study apps are frequently a UI disaster.
The core of the problem is twofold. First, people often dramatically underestimate the time and resources it takes to develop user-friendly applications. The result is applications that aren’t optimized for ease of use, and low retention rates are often the inevitable outcome. Secondly, even if you're committed to investing the time and resources to build a robust digital infrastructure, financing it is very challenging. The traditional grant-making scheme has little room for roles like software or app developers.
We were fortunate to have the support of philanthropic foundations for this project. The support of the Kristian Gerhard Jebsen Foundation was particularly instrumental for this cohort from the very beginning. Without them, this study simply wouldn’t exist.
Building digital infrastructure
As we set out to build the necessary infrastructure for such a cohort, we decided to focus primarily on two areas: the coordination of the study and nutrition tracking. For other aspects, we used existing infrastructure, such as glucose tracking (Abbot Freestyle Libre), and physical activity tracking (multiple devices such as the Apple Watch or Fitbit).
The Food & You website (at www.foodandyou.org) served as the central hub where all data streams came together. Crucially, it was the pacemaker for the study. This was quite a challenge due to the complexity of our setup, which integrated multiple third-party data sources. Moreover, we wanted to be able to combine some of these data sources to create interactive graphs. Importantly, we needed to ensure that participants received just the right amount of reminders to keep them engaged.
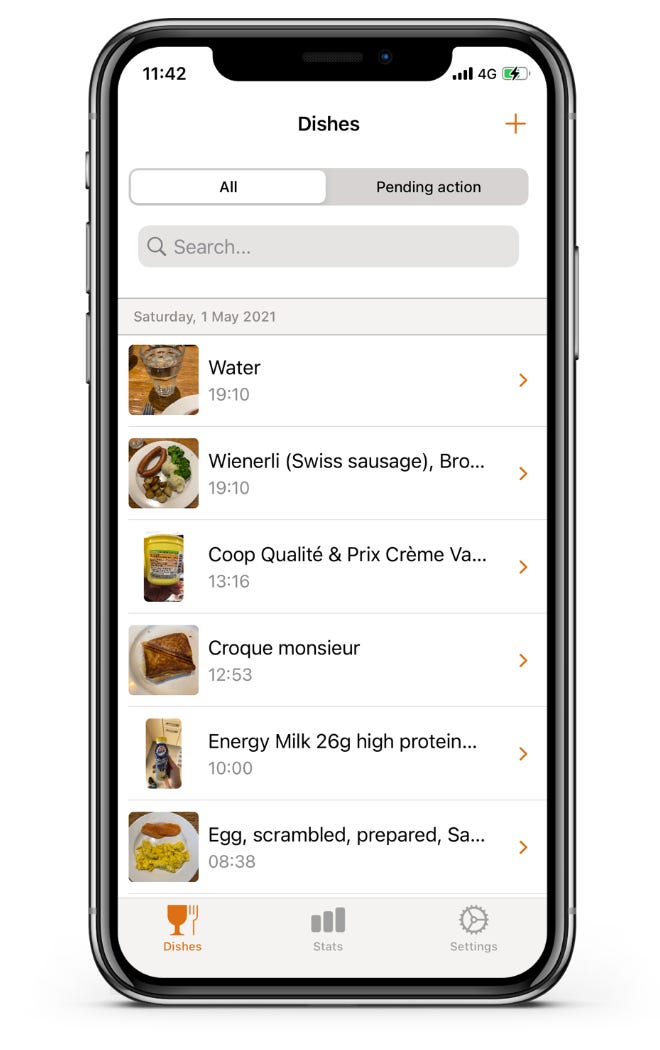
For food tracking, we went all out and developed our own app, MyFoodRepo. This app uses AI for image recognition, combined with a sophisticated backend system where the AI results can be verified or corrected by human annotators. Various aspects of this app's development were quite complex, and I'll cover this in more detail in a separate article solely about the MyFoodRepo app.
It pays off
In the end, even though the cost of infrastructure development was relatively high, we're extremely satisfied with the results. The retention rate was quite high, with more than 60% of enrolled participants completing the study. The study protocol demanded quite a lot from participants: they needed to track everything they consumed by taking pictures or scanning barcodes, wear a glucose sensor, send us a stool sample, fill out two daily surveys, and commit to these tasks, among others, for at least 14 days (some were asked to do this for 28 days).
I'd like to think that our investment in infrastructure was a key factor in achieving this completion rate. Notably, participants who did not complete the study dropped out quite early, mostly upon realizing they weren’t quite in a position to fully adhere to the study protocol. If we had calculated the completion rate for those who followed through with all the initial setup steps (including a 3-day test of diet tracking), it would be even higher, reaching nearly 95%:

Data quality
One of the key challenges in collecting a vast amount of multi-modal data, especially from new data sources, is data quality. For instance, a crucial question for the MyFoodRepo app was whether it could accurately measure nutrition. There are several approaches to addressing this question.
The first approach involves independent validation studies. We were fortunate enough to have a team at UniSanté test the app and assess its performance. While this is useful, it’s beyond our control to request other researchers to validate our app. Additionally, even though the UniSanté validation study was published in 2022, it used an older version of the app, with an algorithm that dates back to 2019. However, the majority of our data was collected with newer, significantly improved versions. I am aware of more recent validation assessments, but those haven’t been published yet.
We thus needed to find additional methods to assess our data quality. We achieved this in three ways, though I won't delve into the details here (they are in the paper if you're interested). Our conclusion is that we have high confidence in our data quality. Still, the question is whether we can convince others, particularly the peer reviewers of our paper, to agree with our conclusions!
There are two summary statistics I’d like to share with you here about nutrition: one is the temporal dynamics of food intake:

I find this figure quite interesting because it nicely demonstrates the expected patterns of food intake timing (note that the y-axis shows food records, not kcal). Specifically, the shift to late breakfast and lunch on the weekend is very apparent, as is the expected resetting of dinner times on Sundays.
Given that we ask people to take pictures of everything they eat - meaning we have timestamped information - it’s perhaps not too surprising that we can obtain such a figure. But what about the quantities and types of food? What would we expect there?
We hypothesized that we'd largely find the same patterns in our cohort as those observed in other studies. In Switzerland, where this cohort was based, there isn’t all that much nutritional data available. However, there is one study called menuCH, a national, representative survey on food consumption and dietary behavior of the population living in Switzerland. We were able to compare key summary statistics of our data with publicly available data from menuCH, and found a high level of agreement:

As previously mentioned, the paper includes more assessments on data quality. We continue to improve the MyFoodRepo system, and I’m pleased to announce that it’s now also available in Germany, the U.S., and the Netherlands. If you're interested in using the app in your study, please don't hesitate to reach out to me.
Recruitment and representation
I’d like to conclude by discussing what I currently see as the main limitation. Our cohort is more educated, and younger, than the Swiss population. This is almost certainly a consequence of our recruitment, which was based on self-selection, predominantly via social media. In a future study, I'd like to achieve better representation of the general population, given that food patterns can vary greatly among different demographic and social groups.
Interestingly, when looking at completion rates among different demographic and social groups, we don’t observe any significant differences. There is a noticeably higher completion rate among people who follow specific diets, but that’s to be expected. Additionally, while we're not seeing any differences in food intake averages when compared to results from a representative study (as shown above), it doesn't imply there aren't any. In a sequel to Food & You, we’d like to emphasize this issue more.
What’s next
For us, this paper represents a major milestone. Many people worked very hard for a long time, and the pandemic was challenging for our lab, not at least because I was so involved in the pandemic response. I'm delighted to say that things have turned out well, and we are now delving into the depths of data analysis, including post-meal glucose predictions, microbiome analysis, and various other fascinating topics.
We're also beginning to plan for Food & You 2. We now have a robust technology infrastructure, which enables us to expand such a study in any direction. I’d be particularly interested in exploring more about the connection between nutrition and cognitive performance. This relationship is intriguing, not only from a biological perspective, but also in terms of creating motivation for individuals interested in the positive effects of dietary modifications.
While we have many ideas about our next steps, I'm nevertheless very interested in hearing from those of you who have a passion for nutrition, especially if you represent a group of people for whom nutrition plays a crucial role, including those for whom it presents a challenge (e.g., those with IBD or other conditions that are heavily influenced by nutrition). It would be a pleasure to develop studies right from the initial stages in collaboration with such groups. Please reach out to us if this sounds appealing to you.
CODA: Where to find me
I’ll make it a habit in these posts to remind people where to find me:
Writing: I write another Substack on practical tips for interacting with large language models, called Engineering Prompts.